Comparing the NIR spectroscopic method with FTIR/FT-NIR
The goal of this article is to compare the near-IR spectroscopic technique with FT-IR and FT-NIR methods. Molecular spectroscopy is the study of the interaction of Electromagnetic waves with matter. Molecular bonds are capable of rotation and vibration, which include bending and stretching. When an electromagnetic wave of appropriate energy level is impingent on a molecule, the energy is absorbed and the molecule starts to vibrate. Since all the fundamental vibrations of the molecules lie in the mid-IR region (between 2.5 m to 25 m), the absorption peaks are much stronger for the mid-IR spectroscopic techniques as compared to NIR spectroscopic methods (in the range 780nm to 2.5 m), which utilizes overtones and combination bands. Figure 1 below shows the overtones and fundamental frequencies for a molecule.
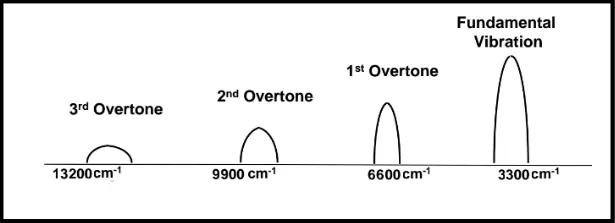
Figure 1: The first and second overtone, fall in the near IR region (1515 nm and 1010 nm), whereas the third overtone falls in the deep red region (757 nm).
In principle, there are two ways in which spectroscopic methods use to probe a material. In one method, called the dispersive method, individual wavelengths which are produced by shining a broadband source on a diffraction grating or a prism are impingent on a material and absorption at each wavelength is measured. Near Infra-red diffuse reflectance method utilizes this technique. In the second method, the full beam of the broad-band source shines on the input of an interferometer where the sample whose absorption is to be measured is placed in one arm. The interferometer consists of a stationary mirror and a moving mirror and the scanning is done through the movement of the moving mirror. An interference pattern is hence recorded whose Fourier transform regenerates the spectral signal. The same measurement is done without the presence of the absorption material in one arm and by dividing the former by the latter, an absorption spectrum for the material is generated. Both FT-IR and FT-NIR utilize this method. Figure 2 shows the interferometer for a FT-IR method:
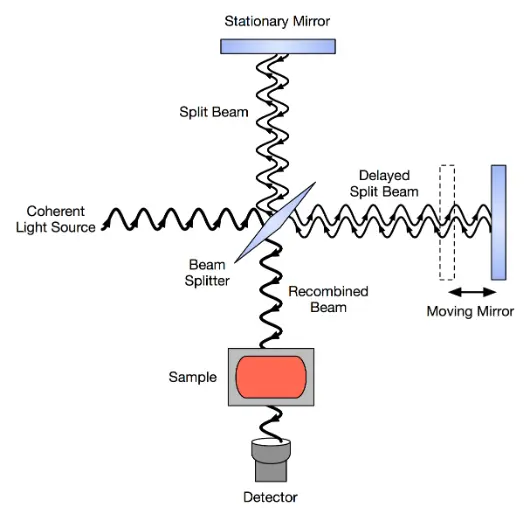
Figure 2: Construction of an FTIR spectrometer
The interferometric method has the advantage of high throughput as compared to the dispersion technique whose throughput is limited by an entrance slit. For this reason, when referring to Mid-IR spectroscopy, FT-IR method is the preferred choice.
Looking at the structure of absorption spectra in mid-IR region, one finds several functional groups such as –CH, -NH2, -OH, -CO, etc. with well defined absorption features. These features are generally narrow, which gives a high resolution to FT-IR methods. The spectra in the nir region however, are overtones and combination bands as mentioned earlier and mainly arise from stretching of O-H (water, alcohol) , C-H (fats, oils and hydrocarbons) and N-H (proteins). These absorption features are broadened as compared to their counterparts found in the mid-IR region.
Comparison of NIR (diffuse Reflectance) and FTIR: The high strength of signal in the mid-IR region is not the only deciding factor as to the choice of technique between nir and FT-IR. In fact high absorption has certain disadvantages in some applications! Here are a list of advantages of dispersive nir instruments over their FT-IR counterparts.
• Water signals are very strong signals in mid-IR so for a material which contains a lot of water such as is the case for most of the food products, the water signal can swamp most of the other useful spectral information.
• If a material is heterogeneous, the mid-IR technique can not probe beyond the surface of the material and hence insufficient information is obtained. To demonstrate this point, a major sampling technique for FT-IR which is called the Attenuated Total Reflection (ATR) is introduced and is shown in Figure 3.
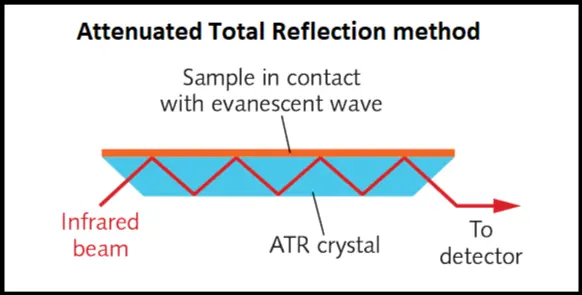
Figure 3: ATR method
In this method a crystal of high refractive index is in contact with the sample surface. An infrared beam undergoes total internal reflection and generates an evanescent wave which penetrates into the material through depth of few microns. Each bounce produces some absorption of the beam and after several bounces, the IR beam reaches a detector. Since the absorption is strong, this technique has the advantage of probing several locations of the sample surface. One can see that this method is effective to probe only a thin layer on the surface of a material and if the bulk of the material needs to be probed, this method will fail.
• For heterogeneous samples which are mostly found in food industry a different approach has to be taken. NIR is the choice for this seedy, watery material because the nir beam can penetrate through the material and bounce several times before reaching the detector. The technique of trans-reflectance is shown in Figure 4.
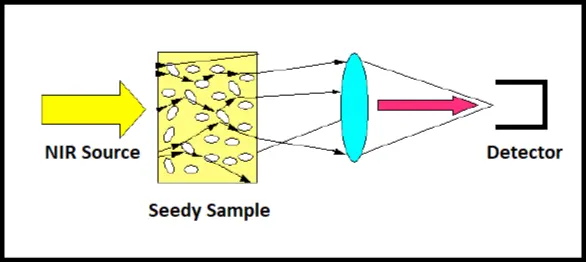
Figure 4: Trans-reflectance method
After undergoing multiple reflection through the volume of the sample, the beam finally finds it way to the detector and hence absorption spectra represent the bulk of the sample rather than just the touch of the surface as was done with ATR sampling technique used for FTIR. The trans-reflectance method has the disadvantage that the source should be separate from the detector and can not be embedded within the spectrometer. Another method, called interactome is shown in figure 5 and is compared with diffused reflectance.
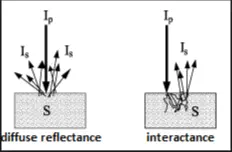
Figure 5: Comparison of interactome and diffuse reflectance
Depending of the type of material being probed, the incident nir beam can undergo diffuse reflection mostly from the surface or penetrate through the sample, undergo multiple reflection and be detected at the same side as the incident beam. This will allow the nir source (such as a halogen-tungsten lamp to be embedded within the body of the spectrometer rather than as a separate source. The NirvaScan Spectrometer introduced by Allied Scientific Pro is an example of a nir spectrometer with a Tungsten Halogen lamp embedded with the body of the spectrometer.
• The size of portable FTIR spectrometers are much bigger than their nir counterparts. A typical handheld FTIR spectrometer can be of dimension 17cmx11cmx22cm excluding a handle whereas a nir-spectro-reflectometer such as the NirvaScan spectrometer (introduced by Allied Scientific Pro) can be as small as 6cmx5cmx3cm (a factor of 45 smaller by volume). An FTIR spectrometer must have a moving part (a moving mirror) whereas a nir spectrometer with an array detector could record all the dispersed wavelengths simultaneously without the use of any moving parts. NirvaScan spectrometer does not have an array detector and utilizes a single element detector. A MEMS mirror will scan different wavelengths very quickly on the detector.
• The cost of a hand-held FTIR spectrometer can be two to three times higher than a handheld nir spectrometer.
• FTIR requires sample preparation to become ready for a measurement whereas the nir instrument require no sample preparation. For most of the measurements in nir, if the sample (such as a pill, seeds of coffee, wonder bread etc.) can be grinded into a powdered form using a pestle and mortar, it will be ready for measurement right away. For crop grains and seeds, the measurement can be done as is.
• Glass windows are non-absorbing in near-IR and can be readily used but for FTIR measurements special, expensive windows such as Potassium Bromide (KBr) needs to be used.
• Inexpensive detectors such as InGaAS can be used for nir spectroscopy but for FTIR one needs to use more expensive detectors such as HgCdTe or pyro-electric detectors which respond to variation in temperature.
Comparison of NIR (diffuse Reflectance) and FT-NIR:
FT-NIR instruments utilize the same method as FTIR with the difference that their source is more suitable for near infrared measurements. FTIR typically uses a Silicon Carbide source which peaks at nearly 5 m as compared to FT-NIR which uses QTH lamps which peak at nearly 2 m. Figures 6 a and b show the source spectra.

Figure 6 a: Silicon Carbide source Figure 6 b: QTH source
The source for the NirvaScan Spectrometer (introduced by Allied Scientific Pro) is a Halogen Tungsten lamp as well. Most of the FT-NIR spectrometers are very bulky and a handheld version is hard to find on the market. This may be due to the fact that a FT-NIR system operating at a shorter wavelength requires more displacement from the moving mirror to achieve a certain spectral resolution. The requirement of a moving mirror is also another disadvantage for the FT-NIR as compared to NIR, which can capture the whole spectra using an array detector with no moving parts.
In conclusion, for heterogeneous samples and those which contain water which is mostly the case for samples in food industry, nir is the preferred choice. Since it is more convenient to have a hand-held instrument which can be taken to a sample rather than a lab based instrument where samples are taken to it, nir is also advantageous to FT-NIR.
References:
1- Near Infrared Spectroscopy, fundamentals, practical aspects and fundamental applications, Celio Pasquini, Journal of Brazilian chemical society, March/April 2003.
2- Comparison of FTIR, FT-Raman, and NIR spectroscopy in a Maple syrup adulteration study, M.M Paradkar et.al, Journal of food science, vol 67, 2002.
3- Analytical vibrational spectroscopy, NIR, IR and Raman, Fran Adar, Spectroscopy online journal, volume 26, issue 10, Oct 2011.
4- NIR Versus Mid-IR: How to choose, Paul Wilks, Spectroscopy online journal, volume 21, issue 4, April 2006.