This article attempts to answer the following questions:
1. What is the use of CIE (International Commission on Illumination) diagram (1931 and 1976), and the meaning of Colour Rendering Index (Ra) in the present CIE standard?
2. Why there is a need to change to a more accurate and broader standard?
3. What are the advantages of the new standard TM-30-15 and how the two new indices, which are called fidelity index (Rf) and Gamut Index (Rg), can be calculated for a light source?
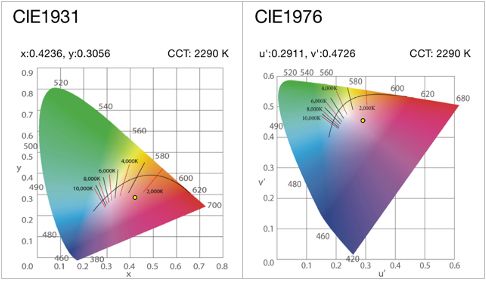
a) The Chromaticity diagrams CIE1931 and CIE1976 show Chromaticity of an illuminating source which is an objective specification of the quality of colour regardless of its illuminance. The chromaticity of the illuminant is specified by a point which has two coordinates on this plot (x,y for CIE1931 and u’,v’ for CIE1976) and describes the coordinates of a Spectral Power Distribution (SPD). Blackbody radiators fall on a curve on this diagram characterized by their colour temperature. Other light sources are characterized by their Correlated Colour Temperature (CCT) and the distance from the Planckian locus, Duv. Figures below show these chromaticity diagrams.
The international Commission on Illumination (CIE) defines Colour Rendering as the effect of an illuminant on the colour appearance of objects by conscious or subconscious comparison with their colour appearance under a reference illuminant. To quantify this comparison, the CIE standard has 8 samples of different reflectivity called Test Colour Samples (TCS) which are illuminated both by the reference source and the test source. The reference source is usually a blackbody for colour temperatures below 5000 K. The average Colour Rendering Index (CRI) or Ra is then calculated as follows:
- After finding the Chromaticity of the illuminant on the CIE diagram, its colour temperature is determined by finding the closest point to the Planckian locus.
- Once the colour temperature is determined, it will be decided what kind of reference source will be used for the comparison test. If the CCT is below 5000K, a blackbody is used but if it is above 5000K, CIE standard illuminant D will be used. The test source and the reference source should have the same colour temperature.
- The 8 standard samples (TCS) will then be illuminated by both the test source and reference source and their coordinates are found on the CIE diagram.
- After some transformations (Called Von Kries transform), the Euclidean distance ΔEi between pair of coordinates are calculated. In this case, i, is an index from 1 to 8.
- Special CRI or Ri is then calculated using the formula Ri=100-4.6*ΔEi. Note that the maximum value of CRI is 100 and a perfect blackbody will render this value. It is also possible to have negative Ri as in the case of low pressure sodium lamp.
- As the last step, the arithmetic average of the 8 calculated Ri values is determined and that will be the average colour rendering index or Ra.
- Fidelity by itself is NOT a complete measure of defining a light source. There is also the chroma parameter which is important to be determined. For example, it is possible for two illuminants to have exactly the same Ra value but one with higher chroma than the average and the other with less chroma than the average. Another index is required to quantify chroma which is missing in the present CIE standard.
- The calculation procedure to determine colour and colour shifts use outdated formulae and tools. A new set of equations and tools are required to replace the outdated procedure.
- The set of 8 color samples (TCS) using which Ra is calculated, do not fully represent our common environment. In particular, Ra is poorly predictive of saturated red colours and needs to be supplemented with the special index R9 for deep red to complete the assessment of colour.
- TCS are more sensitive to some wavelengths than others. The spectral features of its 8 constituent colours are not uniformly distributed throughout the visible wavelength. This could result in the possibility to selectively manipulate Spectral Power Distribution (SPD) in ways that could increase Ra value but do not improve fidelity.
Ra is a measure of fidelity of a light source and the closer its value is to 100, the more the illuminant looks like a natural illuminating source.
b) The present CIE standard has a number of shortcomings that are described as follows:
A new standard which addresses these shortcomings is required.
c) A new standard has been developed by the Illuminating Engineering Society of North America (IES) in recent years and is called IES-TM-30-15. This takes care of the shortcomings of the present CIE standard as follows:
· Colour rendition of a light source is quantified by two indices called fidelity index Rf (quantifies closeness to a reference) and gamut index Rg (quantifies increase or decrease in chroma).
· Instead of using the eight TCS samples used by the present CIE standard, the new standard uses ninety nine samples which are named Colour Evaluation Samples (CES). These samples have a better colour space uniformity and spectral uniformity as compared to TCS samples and obviously cover a broader range of colours.
· A calculation engine based on the state of the art CIE-CAM02-UCS is used to calculate the chromatic adaptation transform and its equations.
The procedure to calculate the colour rendition using this new standard is as follows:
· The chromaticity coordinates of the test source is determined using the CIE 1931 2° method and from the diagram the Correlated Colour Temperature (CCT) of the source is determined.
· Based on CCT, it is decided which source to use as the reference. Depending if the value of colour temperature, a reference source is chosen. For CCT below 4500 K, a blackbody course of the same temperature is used. For CCT between 4500 and 5500 K, a blended blackbody –CIE daylight reference (CIE-D) is used. For CCT above 5500 K is below or above 5000 K, CIE-D reference source is used.
· The 99 standard samples (CES) are each illuminated by the test source and the reference source (In reality only the spectral reflectance function of the colour sample is multiplied by SPD of the source).
· The chromaticity coordinates of the test source and the reference source are calculated using CAM02-UCS which include a chromatic adaptation transformation.
· The Euclidean distance DEi for each colour is determined. Figure 2 shows a relevant plot.

Figure 2: Two dimensional colour plot showing the colour error of each 99 CES
· Rf is calculated by using the following
formulae:


The second equation adjusts the scale such that negative values are NOT produced and the minimum of the scale is zero.
To calculate Rg, the chromaticity diagram is divided into sixteen hue angles of 22.5°. The chromaticity coordinates of the colours within each bin is averaged for both the test source and the reference source..
By joining the 16 averaged points, vertices of a polygon is formed for both the test source and the reference source. Figure 3 shows the two polygons.

Figure 3: Colour gamut index is calculated by the relative area of the two polygons. The arrows represent the increase or decrease in chroma
Rg is calculated from the ratio of the two areas multiplied by 100.
Figure 4, shows a two dimensional colour rendition diagram with Rg on the y axis and Rf on the x axis. Note that the maximum value of Rf is 100 whereas the maximum value of Rg is 140. This is because chroma of a test source could be smaller or bigger as compared to a reference source.

Figure 4: Two dimensional colour rendition plot of Rg versus Rf. The two values were 100 and 83 respectively and the measurement was taken from a florescent lamp. The red dot shows the coordinate of the light source on the plot.
In this two axis system, Rf and Rg quantify characteristics colour fidelity and colour gamut that are important dimensions of colour rendition. An increase or decrease in gamut, makes it necessary for fidelity to decrease. The two values can’t be simultaneously increased. In the figure above, the grey dots represent the colour rendition coordinates for some reference sources stored in a library data base for comparison. The white triangle shows the contour for planckian sources (labeled #1) and the grey triangle border (labeled #2) shows the contour for practical light sources.
Using the Lighting Passport smart spectrometer, one can measure spectral power values in the range 380-780 nm. All the TM-30-15 plots are generated by the lighting passport. Figure 5 shows some of these plots.

Figure 5: TM-30-15 plots