The demand for consumption of fish has increased significantly in recent years due to the desire of consumers to eat healthier food. The market has responded by producing a huge variety of fresh and processed fish products. As a result, the fraudulent substitution of lower grade fish for higher grade fish has become a huge issue in the fishing industry (Reference 1). The substitution of commercially lower value fish can be done voluntarily or can be a result of mistaken substitution because the species look very similar to each other. Verifying the quality of fish and seafood products and ensuring that the information on the label is correct (as far as quality and origin is concerned) is very important.
NIR spectroscopy is the most versatile method of doing this type of testing because of its sensitivity to organic molecules, its ease of use and cost effectiveness. The recent technological development in spectroscopic instrumentation, and the availability of miniaturized and handheld spectrometers on the market, will help this identity verification task in the food sector. It also needs to be mentioned that there are other competing techniques such as Nuclear Magnetic Resonance (NMR) (Reference 1), Hyper-spectral imaging (Reference 1,2) and fluorescence spectroscopy (Reference 1) that are capable of detecting fraud in the fishing industry. Sometimes these techniques can be used in collaboration with each other. However, the article focuses on the role of Near-IR spectroscopy for this task. Analytical approaches such as chemometrics play an important role in falsification detection because they are able to recognize similarities and differences within the spectra that can be used to distinguish fraudulent substitution in the fish industry.
When it comes to the authenticity issues in the fish industry, four categories can be named (Reference 1) which are
• Species substitution
• Production method and farming system mis-representation
• Geographic origin falsification
• Fresh for frozen/thawed product substitution
All of these fraudulent activities and their detection using NIR spectroscopy are discussed in this article. Monitoring of fish products for these fraudulent activities is impeded by the increasing spread of highly processed fish products for which the presence of different types of fraud can be hidden with ease. There are also external factors that could be used for identification of fish in each category. For example, the presence of higher levels of heavy metals or residues of anti-biotics and pesticides are more likely to be found in farmed products than in wild ones. The article will next examine each of the fraudulent activities.
Species Substitution
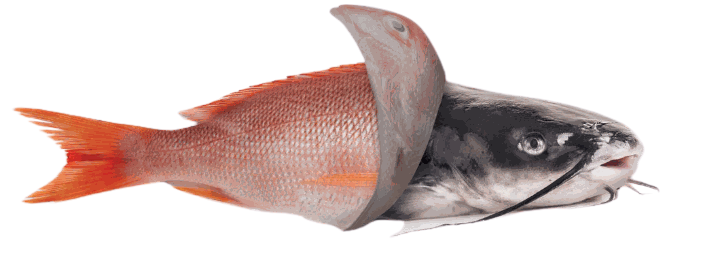
Substituting a higher quality fish by a lower quality or counterfeit fish is a common problem that is growing day by day. A scientific in-situ test that could quickly confirm the contents of the fish as mentioned on the label is highly in demand. Figure 1 shows a depiction of species substitution

Figure 1: Fraudulent substitution of fish
As an example of the use of NIR for identification of fraudulent fish substitution, one can name the research done on discrimination between two different species of low value and high value mullet, cod and trout. The research used a Near-IR spectrometer (906-1048 nm) to make measurements of the full body and fillet of each species and chemometrics analysis such as PCA and SIMCA were performed to make the distinction (Reference 3). Both methods are classified under multivariate analysis. It was found that although PCA could distinguish between low quality and high quality whole fish mullet, it failed in all the other categories. However, SIMCA was successful in distinguishing between low quality and high quality mullet, cod and trout in both full fish and fillet forms. Usefulness of Near-IR spectroscopy was also explored in identification of different species of fish used to make fish meal under industrial conditions (Reference 4). Fishmeal is generally used for products that feed animals and are not meant for human consumption. Near-IR measurements in the range 1100-2500 nm range were performed for salmon, blue whiting and mackerel. Second derivative of the spectra was subjected to PCA, PLS-DA chemometrics methods and the three species were differentiated with a classification accuracy of greater than 80%.
Production Method and Farming System Substitution
Figure 2 shows a fresh and a farmed salmon and the difference in appearance between the two
 Figure 2: Difference between fresh and farmed salmon
During the last few years, the production of farmed raised fish have been increasing steadily as compared to wild fish supplies. There are differences in the nutritional values of the two. Wild fish contains higher levels of muscle protein and also higher levels of saturated and poly-saturated fatty acids. However, farmed fish contains more mono-saturated fatty acids and lipids. The colors are different too as depictured in figure 2. Farmed salmon has a paler pink color as compared to reddish wild salmon. As an example of the use of NIR spectroscopy to distinguish between farmed and wild fish, correct classification was performed using near IR measurements and a PLS-DA chemometrics method to differentiate between concrete tank sea cultured seabass and sea-cage cultured seabass with 87% rate of success (Reference 5).
Geographical Method Falsification
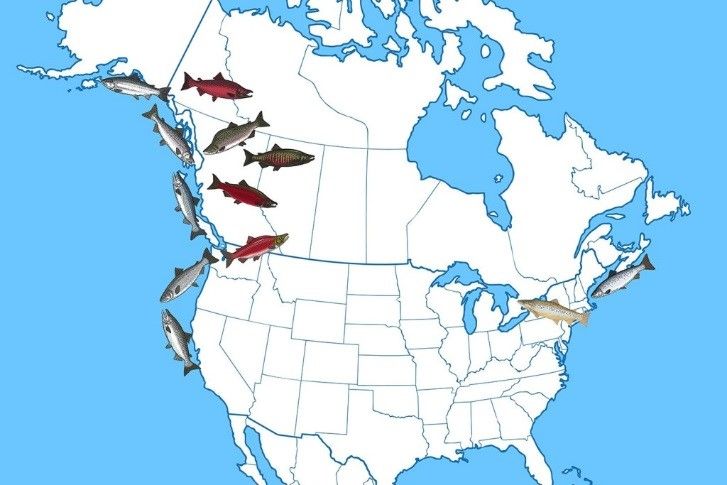
Figure 3 is a depiction of geographical origin of salmon from different geographical areas.

Figure 3: Geographical origin of any type of fish such as salmon could be different (Reference 6)
Proving the geographical origin of a particular type of fish is quite difficult because modelling the total variability of NIR spectra and directing it towards the geographic origin involves a sum of huge intrinsic or extrinsic factors such as genetic, growth pattern, muscular activity, water temperature, etc. (Reference 1) . Near-IR spectroscopy has been used less frequently for this distinction and usually multi-disciplinary methods are used for this purpose. These multi-disciplinary methods take into account the environmental factors and genetic information that affect the final characteristics of the fish.
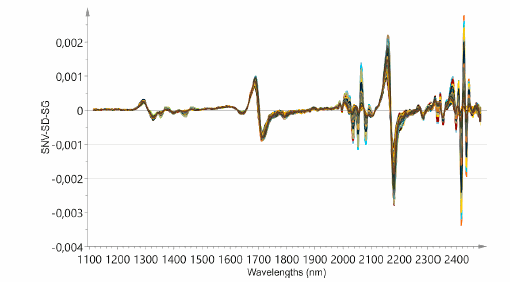
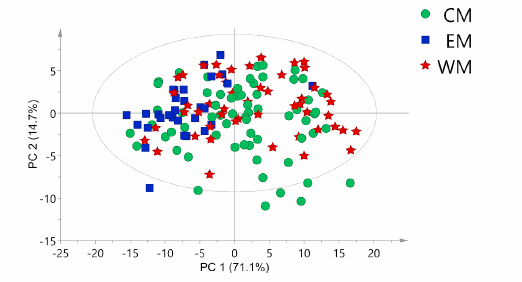
As an example of using NIR spectroscopy to find the geographical origin, one can refer to a study in which Chinese Tilapia fillet from 3 different provinces of china (Guangdong, Hainan and Fujian) were studied using NIR spectroscopy (Reference 7). In the study, near-IR spectra of the fish was collected in the range 1000-2500 nm and a chemometrics method called SIMCA was used with 80% success rate in distinguishing the different geographical origins. As an another example, European seabass from the western, central and eastern Mediterranean sea provenances were studied using NEAR-IR spectroscopy and a PLS-DA chemometrics method managed to classify 100% eastern, 88% central and 85% western provenances correctly (Reference 8). Figure 4 shows a typical pre-processed spectra from sea bass samples and grouping based on a score plot after doing a PCA analysis where CM, EM and WM refer to Central, Eastern and Western Mediterranean.


Figure 4: Preprocessed spectra of sea bass and score plot grouping based on geographical location (Reference 8)
Discrimination Between Fresh And Frozen/Thawed Seafood
Figure 5 shows a comparison of fresh and frozen salmon.
 Figure 5: Fresh and frozen salmon
Fish is usually frozen to preserve it for longer periods of time. However, the quality of frozen fish is much lower than fresh fish. That’s why fraudulent practices often times try to substitute a frozen/thawed fish in place of a fresh fish. When a fish is frozen, there are some chemical and physical variations that are imperceptible by sensory organs and the NIR spectroscopy is one way to detect these tiny changes. As an example of use of NIR spectroscopy to differentiate between a frozen/thawed and fresh fish, one can refer to a research in which sword fish was studied for its freshness or frozen/thawed quality using NIR spectra in the range 1100-2500 nm (Reference 9). After applying a chemomterics method PLS-DA a 93% successful classification was obtained.
Hyperspectral Imaging
Hyperspectral imaging uses cameras with a large number of pixels and obtains a spectral image for each pixel in the image of a scene that can also used to detect falsification of fish. In one study involving fresh and frozen/thawed halibut, hyperspectral cameras were used in the range 380-1030 nm and after applying a chemometrics method, a classification success rate of nearly 92% was obtained (Reference 10).
Allied Scientific Pro’s NIR Spectrometer
Allied Scientific Pro offers the Nirvascan spectrometer which uses Texas Instruments Digital Light Processing (DLP) technology. There are two ranges that are available whicih are 900-1700 nm and 1350-2150 nm. The spectrometer suitable for fish impurity detection is the reflective model which is a portable Spectrometer. The NIR spectrum can be recorded in a few seconds by the press of a button. The following link has more information about this spectrometer.
References:
1-Approaching authenticity issues in fish and seafood products by qualitative spectroscopy and chemometrics, S. Ghidini et.al, Molecules, 2019, 24, 1812
2-Quality evaluation of fish by hyperspectral imaging, chapter 8 of Hyperspectral imaging for food quality analysis and control, edited by Da-Wen Sun, Decmeber 2010.
3-Near Infrared spectroscopic authentication of seafood, N.O’Brien et.al, Journal of near infrared spectroscopy, 2013, 21.
4-Usefulness of Near-infrared reflectance (NIR) spectroscopy and chemometrics, to discriminate fishmeal batches made with different fish species, D. Cozzolino et.al, Journal of Agric .Food. Chem, 2005, 53.
5-Application of non-invasive techniques to differentiate sea bass quality cultured under different conditions, C. Costa et.al, Aquac. Int. 2011, 19.
6-https://fishingbooker.com/blog/types-of-salmon/
7-Prediction of chemical composition and geographical origin traceability of Chinese export tilapia fillets products by near infrared reflectance spectroscopy, Y. Liu et.al, LWT-food Sci.Technology, 2015, 60.
8-Rapid authentication of European sea bass according to production method, farming system, and geographical origin by near infrared spectroscopy coupled with chemometrics, S.Ghidini et.al, Food Chem, 2019, 280.
9-Comparison of visible and near infrared reflectance spectroscopy to authenticate fresh and frozen-thawed sword fish, L.Fasolato et.al, J.Aquat. Food. Prod,. Technol. 2012, 21.
10-Application of visible and near infrared hyperspectral imaging to differentiate between fresh and frozen-thawed fish fillets, F.Zhu et.al, Food Bioprocess Technol, 2013,6.