There are several important considerations when it comes to laser cleaning. When the laser cleaning methodology is compared with other cleaning methods such as sand-blasting or water-jetting one should think of the following criteria1,2:
● How effective the material removal has been using the method?
● What is the impact on substrate material?
● Suitability of the treated substrate for the follow up coating?
For the first question, a research study1 which used a pulsed YAG laser (24 kHz pulse frequency, 83 ns pulse duration) on stainless steel reports a maximum speed of 19 ft2/hour on a 10 mil (0.25 mm) coated sample using a 7.6 cm scan width. This speed is slower than some other competing methods such as sandblasting but laser cleaning offers the huge benefit of environmental cleanliness.
As for the effect on the substrate material, the same research study1 shows that above a certain fluence level (3 J/cm2) there will be a melting and a substantial rise in temperature.
After application of paint layers and usage for several years, the paint needs to be removed. The question is how does laser cleaning affect the substrate’s roughness after removing the paint. Some other cleaning methods such as water jetting remove all surface roughness, so the subsequent layers of paint can’t be applied directly. Sandpaper needs to be used to roughen the surface. That is not the case with laser cleaning since it could also increase the initial surface roughness depending on the process parameters.
One has to consider several factors to examine the effects of different laser process parameters on surface roughness. These parameters are listed below and are examined one by one:
Cleaning speed
Cleaning times
Laser power
Pulse frequency
Overlap ratio
Energy density
1. Cleaning Speed and Cleaning Times
One has to distinguish between the cleaning speed and the scan speed. The scan speed is produced by the galvo scanners and basically the laser spot forms a line of a certain width. The cleaning speed is perpendicular to this line and is along the direction of the movement of the laser head (sweep direction). The cleaning speed direction is shown in figure 2.
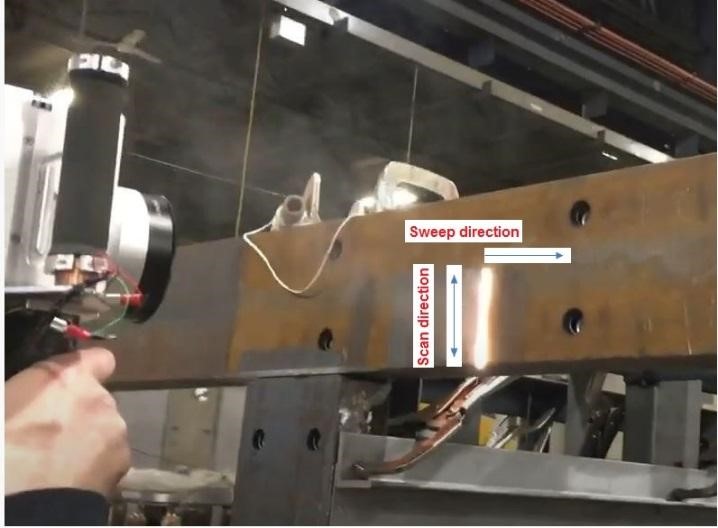 Figure 2: Cleaning speed direction is along the sweep direction
According to one research study for the aluminum alloy substrate4, at low cleaning speeds (18cm/min) the roughness first increased with cleaning times and then decreased with further increase in cleaning times. At higher speeds (27 cm/min and 36 cm/min) the surface roughness increased with cleaning times. This is shown in figure 3.
As for the same cleaning times, the change of roughness was different at different cleaning speeds. After one cleaning run, the roughness first decreased sharply with cleaning speed and then slowly increased with further increase in cleaning speed. At twice the cleaning times, the surface roughness decreased with increasing speed although sharply at first and then decreased more slowly with further increase. At higher cleaning times of 4, the roughness first increased and then decreased with increasing speeds. At 18 cm/sec and 36 cm/sec the surface roughness value was the same with a maximum value at a speed of 27 cm/min. This behaviour is once again shown in figure 3.
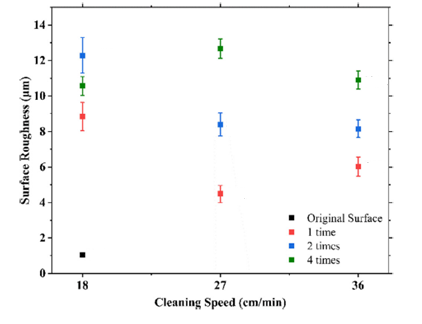 Figure 3: At different Atr cleaning times, the roughness behavior varies with cleaning speed4
3. Energy Density and Overlap Ratio
Surface roughness shows a linear increase with increase in energy density4 as shown in figure 5. It is also observed that although two samples (A3 and A5) had different process parameters (80 W-240 kHz and 40 W-120 kHz) since their energy densities were similar (17.0 J/cm2 using spot diameter of 50 μm and the equation F=P/(f.π.d2) where F is energy density, P is the power, f is the pulse frequency and d is the laser spot diameter), they produced similar roughness of nearly 6 μm. Figure 5 shows the plot of surface roughness vs. energy density.
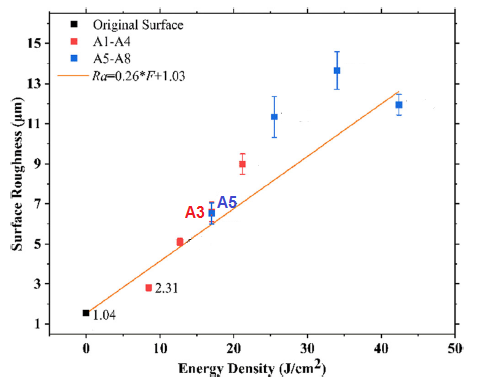 Figure 5: Linear dependence of surface roughness on energy density
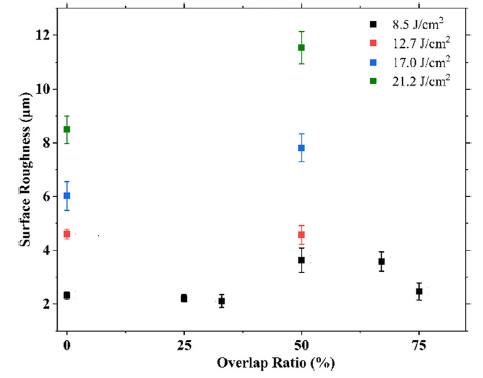
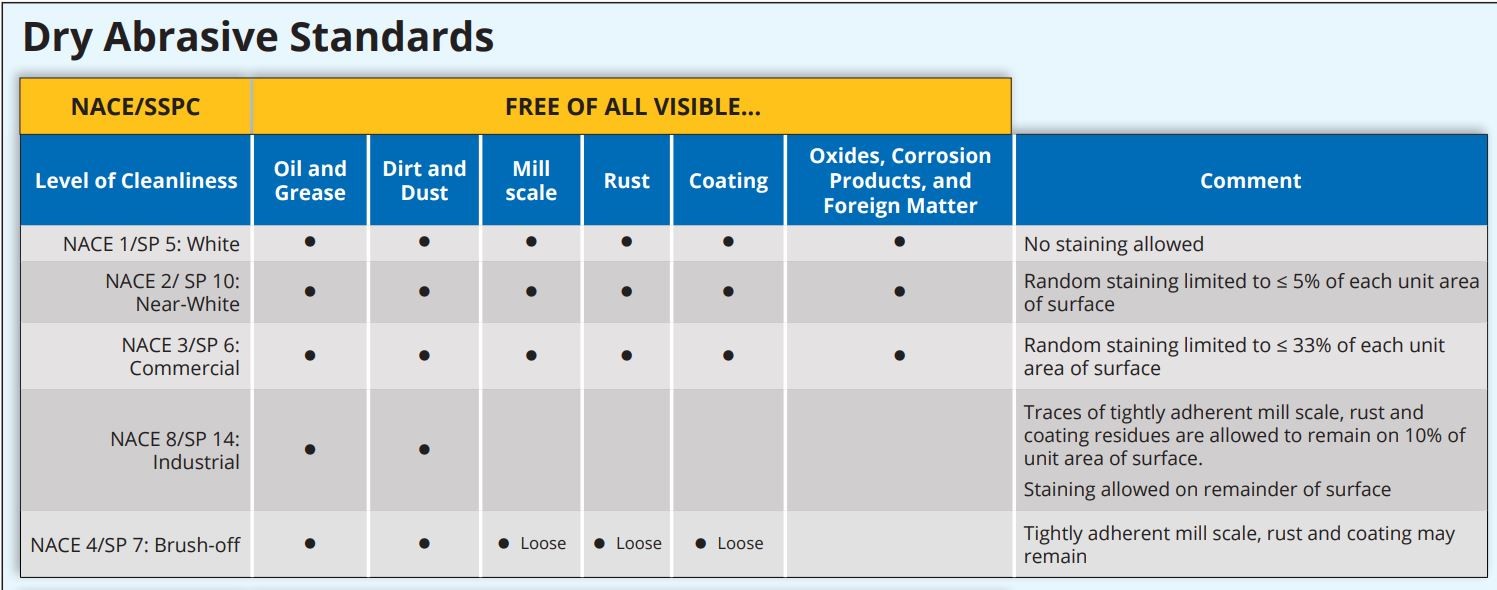 Figure 7: Requirements of each standard5